| |
Sampling Plans | Site Map |
| Software Area:
|
Acceptance
Sampling:
|
| Poisson Examples of
TP105 Sampling Plans for Count Data |
visitors= |
- Decision Rules
- Fixed-n decision rule
- Sequential decision rule table
- Sequential decision rule diagram (text)
- Sequential decision rule exported & displayed as an MS Excel chart
- Sequential slope and intercept
- Performance Curves (for matched fixed-n & sequential plans)
- Performance curve tables by Pa
- Performance curve tables by p'
- OC-Curve graph (text)
- OC-Curve graph exported & displayed as an MS Excel chart
- AOQ-Curve graph exported & displayed as an MS Excel chart
- ASN-Curve graph exported & displayed as an MS Excel chart
- ARL-Curve graph exported & displayed as an MS Excel chart
![]()
Fixed-n Decision Rule for Count Data
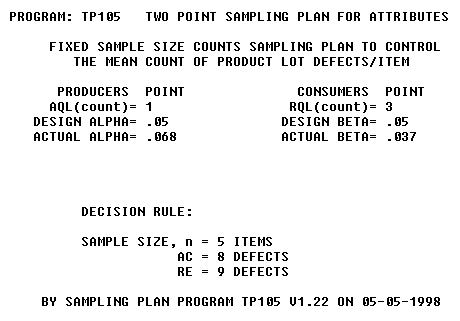
The sampling plan documents the type of plan, the two points on the oc-curve that specified the plan, the decision rule, and the date and version of the software.
![]()
Sequential Decision Rule: n-Table for Count Data
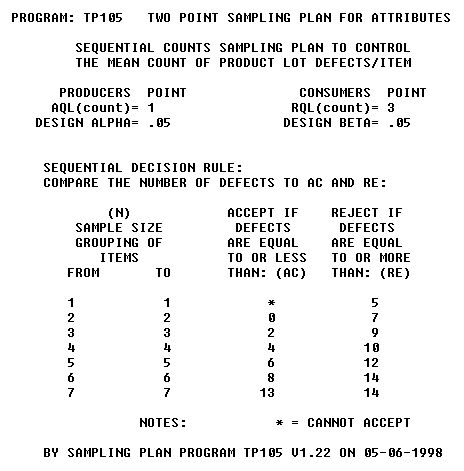
The n-table refers that you enter the table with the left two sample size (n) columns.
![]()
Sequential Decision Rule: X-Table for Count Data
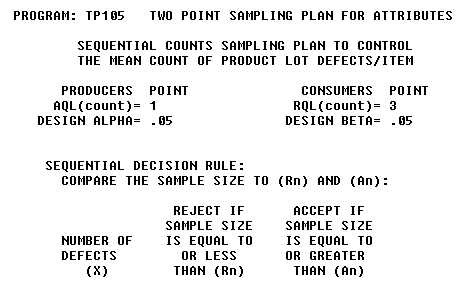
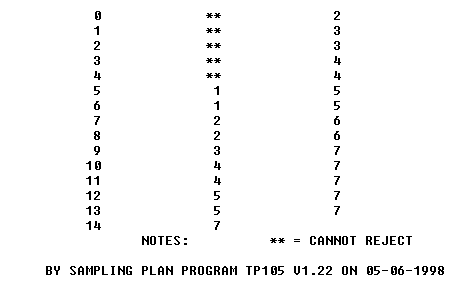
The x-table refers that you enter the table with the left defectives (x) column.
![]()
Sequential Decision Diagram for Count Data (text)
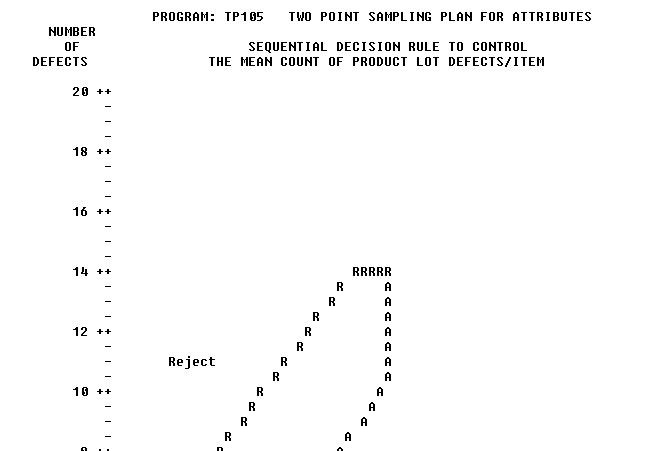
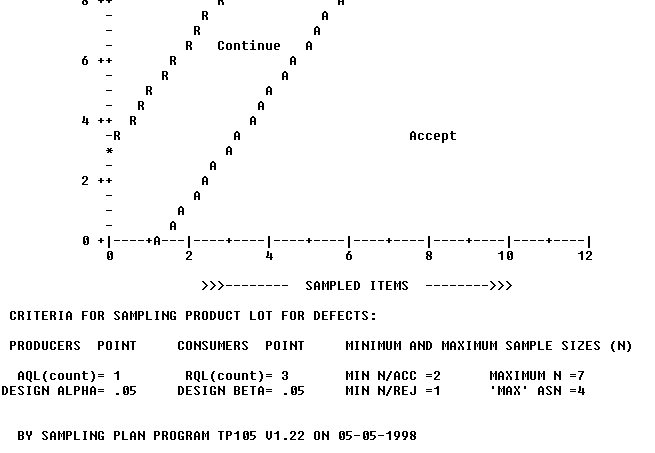
The minimum and maximum sample sizes shown in the reports footer above can be verified by the diagram. The minimum n to accept = 2 occurs when the first two sampled items contain zero defects. The minimum n to reject =1 occurs when the first sampled item has 5 defects. The maximum n = 7 sampled items is the right-hand truncation of the continue zone. The truncation is user-controlled but otherwise defaults to a good-practice value. The 'maximum' ASN =4 sampled items is the maximum of the ASN curve.
![]()
Sequential Sampling Plan for Count Data from TP105
Displayed as an MS Excel Chart
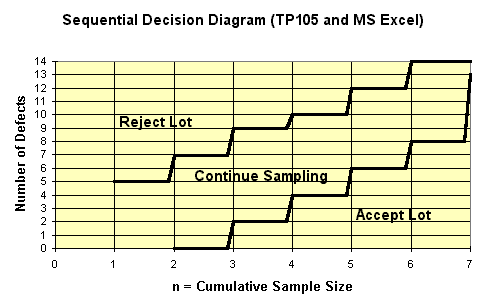
Plot the data on the diagram sequentially as it is collected. The accept or reject decision is made when sample data plots on or over an acceptance line or rejection line. The stair step pattern is caused by the discrete nature of the sample size and the number of defectives in the n-table upon which this diagram is based.
![]()
Slope and Intercept of Sequential Lines for Count Data
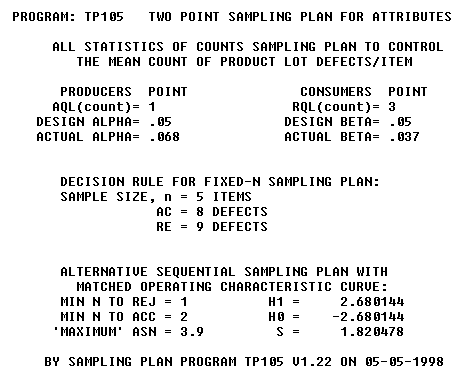
This report provides the slope and intercepts of the parallel acceptance and rejection lines of the sequential sampling plan who's oc-curve matches that of the fixed-n curve shown.
![]()
Performance Curve Tables by Pa -- Matched Fixed-n & Sequential
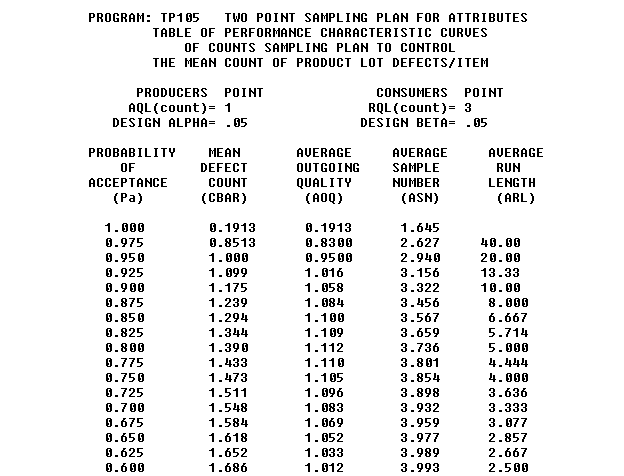
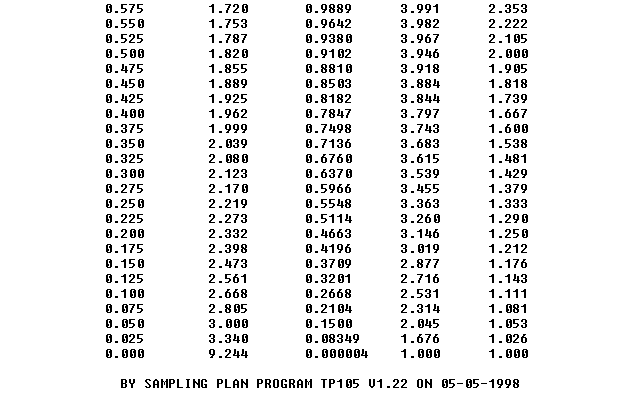
The left column (Pa) has constant step-size.
![]()
Performance Curve Tables by c' -- Matched Fixed-n & Sequential
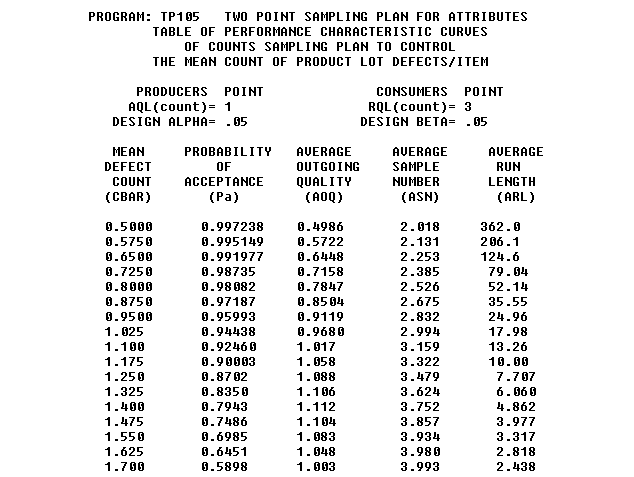
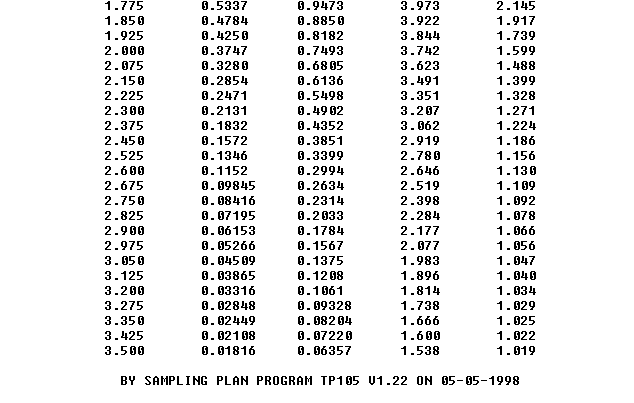
The left column (c') has constant step-size. This table was used to build the four MS Excel charts below (OC, AOQ, ASN, and ARL)
![]()
Operating Characteristic Curve Graph for Count Data (text)
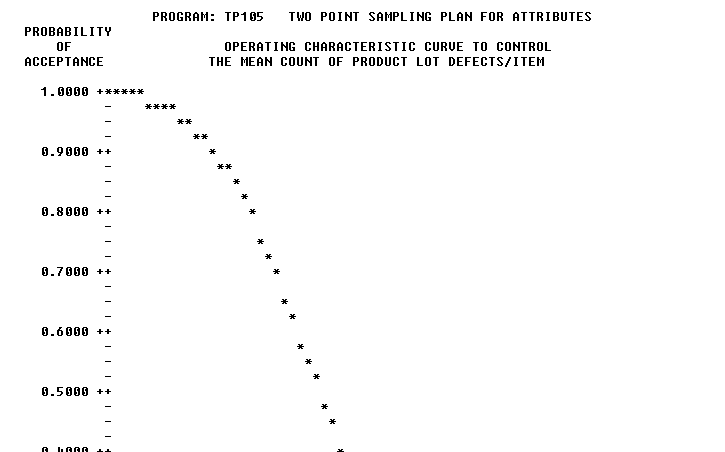
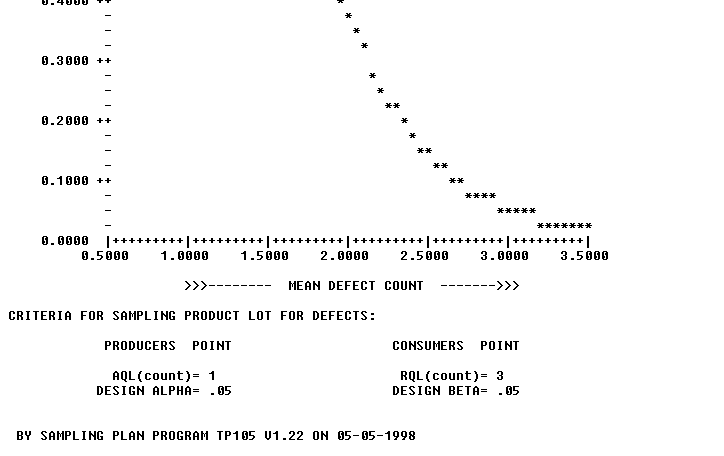
In most cases, this text graph is sufficient to evaluate and/or compare sampling plans.
![]()
OC-Curve from TP105 Displayed as MS Excel Chart for Count Data
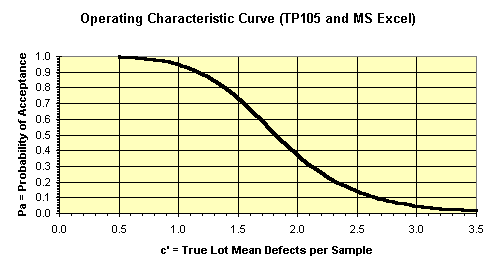
This chart was made with the MS Excel chart wizard after writing the TP105 performance table to a file, importing it into Excel, and using [data][text to columns] in Excel to parse the tabular data into columns. This procedure has been tested with Excel 5.0 and 7.0(7.0 is office 95)
![]()
AOQ-Curve from TP105 Displayed as MS Excel Chart for Count Data
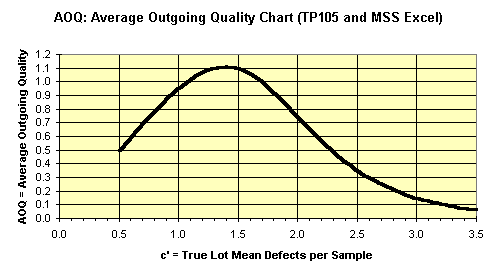
This AOQ curve is based on AOQ = Pa * c'. It is not adjusted for lot size.
![]()
ASN-Curve from TP105 Displayed as MS Excel Chart for Count Data
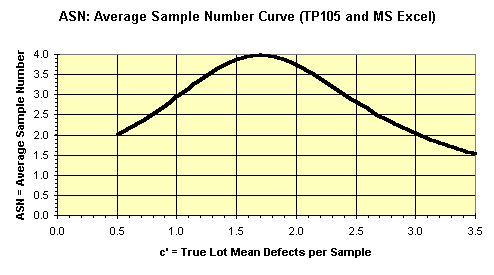
The ASN-Curve is useful to estimate the sample size that will be required by a sequential sampling plan for various lot mean defects per sample.
![]()
ARL-Curve from TP105 Displayed as MS Excel Chart for Count Data
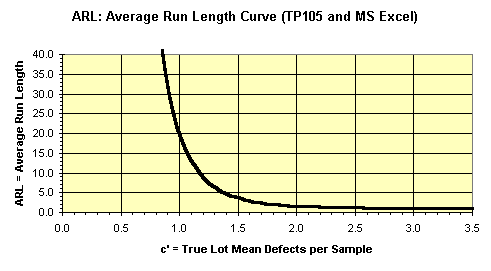
The ARL is the average number of lot acceptances (a run) before a lot is rejected. You want a high ARL at the producer's point and a low ARL at the consumer's point.
![]()